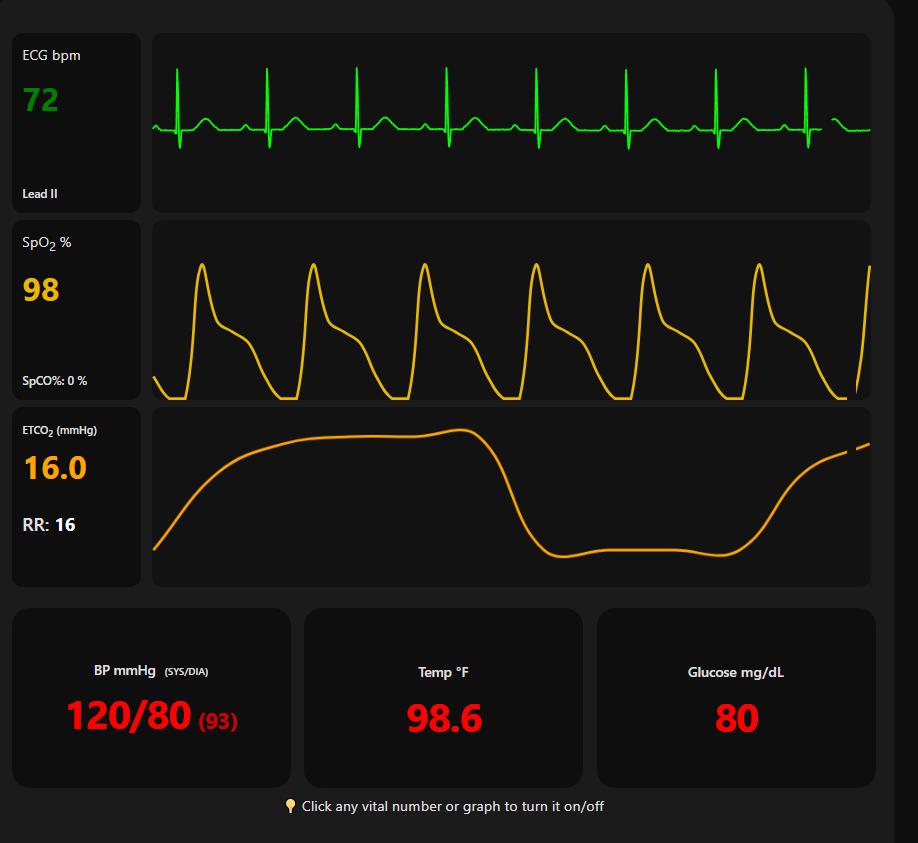
A vitals monitor displays heart rate, blood pressure, SpO₂, resp reading rate, and temperature. No single reading tells the full story, trends over time matter most.
This guide breaks down every parameter, what danger looks like, and how to build this skill safely before working with real patients.
Learning how to read a vital signs monitor is one of the most practical skills in modern healthcare, used daily in emergency departments, ICUs, operating rooms, and general wards.
Whether you are a student, nurse, paramedic, or clinician, understanding how to interpret the numbers and waveforms on a vitals monitor can help you spot early warning signs and respond faster.
This guide explains what you see on the screen, how to interpret it, and how to practice safely using modern simulation tools like an ECG simulator and vital signs simulator.
What a Vital Signs Monitor Shows?
A vital signs monitor typically displays several key parameters in one interface:
- Heart rate (HR) - in beats per minute (bpm).
- Blood pressure (BP) - systolic over diastolic in mmHg.
- Oxygen saturation (SpO₂) - percentage of hemoglobin carrying oxygen.
- Respiratory rate (Resp Reading) - breaths per minute.
- Body temperature (Temp) - in °C or °F.
Many display monitors also show a live ECG waveform, which lets you see the heart's electrical activity and rhythm. In advanced settings, you may also see invasive pressures or cardiac output values.
How to Read the Numbers on a Vital Signs Monitor?
Each numeric value on a vitals monitor corresponds to a specific body function:
Heart Rate (HR)
Normal adult range is 60–100 bpm at rest.
- Above 100 = Tachycardia
- Below 60 = Bradycardia
Neither is automatically dangerous context matters. An irregular waveform with no clear P waves may indicate atrial fibrillation, where the number on screen may not match the pulse you feel at the wrist.
These thresholds apply to adults, pediatric and geriatric patients have different normal ranges, covered in our complete vital signs by age reference.
Blood Pressure (BP)
Displayed as systolic over diastolic in mmHg. A common reference is around 120/80 mmHg, but targets vary by age, condition, and guideline.
One reading means little. Trend over time matters more. A drop from 140/90 to 90/60 over one hour is a red flag, even if 90/60 alone seems tolerable.
Oxygen Saturation (SpO₂)
- 95–100% = Normal in healthy adults
- Below 94% = Investigate
- Below 90% = Act immediately, oxygen therapy or airway assessment required
A flat or irregular SpO₂ waveform often means poor probe contact, not true desaturation. Always verify clinically before acting on the number alone.
Respiratory Rate (RR)
Normal adult range is 12–20 breaths per minute.
- Above 20 = Tachypnea can signal pain, hypoxia, or early sepsis
- Below 12 = Bradypnea can signal opioid effect or neurological compromise
Resp reading rate is the most undervalued vital sign and one of the earliest indicators of patient deterioration.
Body Temperature
Normal is about 37°C (98.6°F).
- Above 38°C = Possible infection or inflammation
- Below 35°C = Hypothermia, possible shock
An interactive vital signs simulator can help you practice reading these numbers across different clinical scenarios so you build pattern recognition over time.
What is a Cardiac Rhythm Simulator and EMS Cardiac Monitor?
A cardiac rhythm simulator is a tool that generates realistic heart rhythms and ECG waveforms for training purposes. It lets users see how different rhythms such as sinus rhythm, atrial fibrillation, ventricular tachycardia, or asystole appear on screen and how they relate to vital signs.
This is especially useful for paramedics and EMS staff who must make quick decisions using an EMS cardiac monitor in the field.
An EMS cardiac monitor is a portable vitals monitor that provides continuous ECG, heart rate, SpO₂, and often non-invasive blood pressure.
Learning to read it confidently requires repetition which is exactly what a cardiac rhythm simulator provides without relying on real patients.
Together, a cardiac rhythm simulator and EMS cardiac monitor let learners practice:
- Reading ECGs in real-time
- Recognizing dangerous arrhythmias
- Making correct treatment decisions under pressure
This helps them move from book knowledge to real-world readiness before working with actual patients.
Danger Signs — When to Act Fast
| Setting | Frequency |
|---|---|
| Stable inpatient ward | Every 4–8 hours |
| High-risk or post-procedure | Every 15–60 minutes |
| Emergency or ICU | Continuous with alarms |
| Transporting | Every 15 minutes |
How often Should Vital Signs be Monitored?
| Pattern on Monitor | What It May Mean |
|---|---|
| HR >120 + systolic BP <90 | Shock |
| SpO₂ <90% not improving | Respiratory failure |
| HR >150 or <40 with symptoms | Dangerous arrhythmia |
| RR >30 or <8 in an adult | Respiratory emergency |
| Rising HR + falling BP over time | Hypovolemia or sepsis |
| Falling SpO₂ + rising RR together | Impending respiratory failure |
How to Interpret Changes Over Time
A single reading on a vitals monitor tells only part of the story. What matters more is trends.
Three patterns every monitor reader must know:
- Rising HR + Falling BP Classic early sign of hypovolemic or septic shock. Individual readings may still look acceptable, the direction of change is the warning.
- Falling SpO₂ + Rising RR The patient is working harder to breathe and starting to fail. When SpO₂ drops below 94% and RR exceeds 25, act immediately.
- Widening Pulse Pressure + Slow HR Systolic rising, diastolic falling, HR slowing possible raised intracranial pressure (Cushing reflex). Critical in trauma patients.
Practicing with a vital signs simulator lets you see how these trends evolve and how interventions alter the display, building real clinical judgment.
Whether you're a student running solo drills or an instructor who wants to control vital signs for a class, the same underlying tool adapts to both.
How to Practice Without a Real Patient
Most training programs give limited monitor time — especially early on. Simulation-based tools close this gap by letting learners practice reading vitals, recognizing rhythms, and spotting trends repeatedly, safely, and without risk to real patients.
Many educators now use:
- Vital signs simulator environments that recreate hospital-grade monitors
- ECG simulator modules for rhythm interpretation
- Cardiac rhythm simulators for team-based scenario training
Simulation-based tools like TrainingMonitor.App close this gap. They let learners practice reading vitals, recognizing rhythms, and spotting trends repeatedly, safely, and without risk to real patients.
TrainingMonitor.App is a vital signs simulator that offers a browser‑based training environment that simulates hospital‑grade patient vitals monitor displays, ECG simulator outputs, and integrated cardiac rhythm simulator views.
Frequently Asked Questions
What is the most important vital sign?
No single parameter is most important. All five work together. Respiratory rate is the most commonly undervalued, it is often the first sign something is wrong.
Can I learn to read a vitals monitor outside a hospital?
Yes. Browser-based platforms let you practice ECG rhythms, vitals trends, and monitor interpretation anywhere. Many EMS and nursing programs now use these tools before students enter clinical placements.
What is the difference between a vitals monitor and an ECG monitor?
A vitals monitor shows all parameters together HR, BP, SpO₂, RR, temp, and a basic rhythm strip. A 12-lead ECG machine focuses only on the heart's electrical activity across multiple leads for detailed arrhythmia or ischemia diagnosis.
How do I know if an SpO₂ reading is accurate?
Check the waveform. A strong, regular pulse waveform means the reading is reliable. A flat or erratic waveform suggests poor probe contact or poor peripheral perfusion reposition the probe and reassess before acting on the number.
What does a normal ECG look like on a bedside monitor?
A regular rhythm, 60–100 bpm, with a visible P wave before each narrow QRS complex, and a clear T wave after. The baseline between beats should be flat with no extra spikes or waves.